Ready to proof — CLJ 2/8/22
KJ proofed on 2/10 and sent Clare corrections
Revised on 2/10
Ready for

Photo: Ivan-balvan, iStock/Getty Images Plus, via Getty Images
Paints & Coatings 2022
Understanding the Chemical Industry and Current Challenges for Coatings and Adhesives, Part 1
By Michael Rezai, Senior Consultant, The ChemQuest Group, Cincinnati, OH
Global Chemical Industry Overview
This two-part series will examine the challenges we have been experiencing in the coatings and adhesives industries since the onset of COVID-19 and offer a look ahead for 2022-23, with the understanding that if we have learned anything in these past 24 months, it is that nothing is certain any more. Our global industries are gathering together for the first time in 4+ years at the American Coatings Show and World Adhesive Conference in March and April 2022. It seems almost unbelievable that these events will be held in person, in light of our changed world. Even more important, almost every product we use on a daily basis is influenced by the chemical industry. This is the industry that feeds our coating and adhesive platforms. It's no secret that COVID-19 wreaked havoc on the chemical industry (#5 hardest-hit industry). Chemical demand was shattered throughout end markets. Global supply networks were disrupted. Chemical company stock prices took enormous losses. And the competitive order of chemicals producers shifted almost immediately. Figure 1 shows the impact on chemical demand across various end markets.
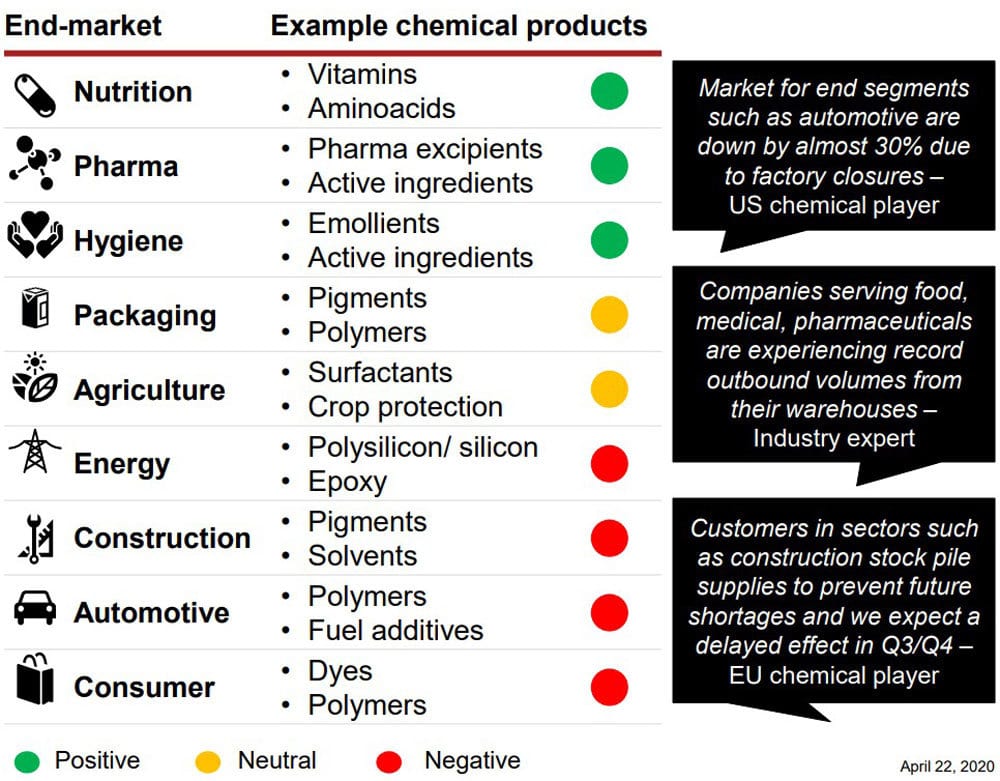
FIGURE 1 ǀ Demand impact across chemicals end markets.
(Source: Strategy&, WEF)
Global supply disruptions, rolling COVID-19 restrictions, the February 2021 deep freeze in the United States along with Hurricane Ida in August, as well as container shortages and logistics constraints causing extended lead times, have resulted in basic commodity shortages all the way down the supply chain to finished goods. The chemical industry was shaken to its core by the looming worldwide energy scarcity (from oil to natural gas to coal) and the resulting price spike.
As a result, chemical businesses are functioning in a fundamentally different environment. On the plus side, the world economy appears to be in the midst of a rapid and steep "V"-shaped rebound, and sentiments for 2022 are generally positive, with global GDP forecast to expand by 4.4%.
The global industrial economy has continued to be resilient to many demand headwinds — whether related to inflation, supply chain issues or lockdowns. In November, U.S. industrial production held steady on the month at +5.3% year over year, while China pushed higher to 3.8% (Figure 2). Although the total number of countries in manufacturing expansion fell 5% to 89%, developed markets remain at historically high levels.
Looking ahead, industrial production in the U.S. is expected to grow slightly year over year, driven by COVID vaccine tailwinds, pent-up demand and fiscal spending (Figure 3). Also, consumer-related manufacturing, factory parts/machines and energy-related spending should also be strong in 2022.
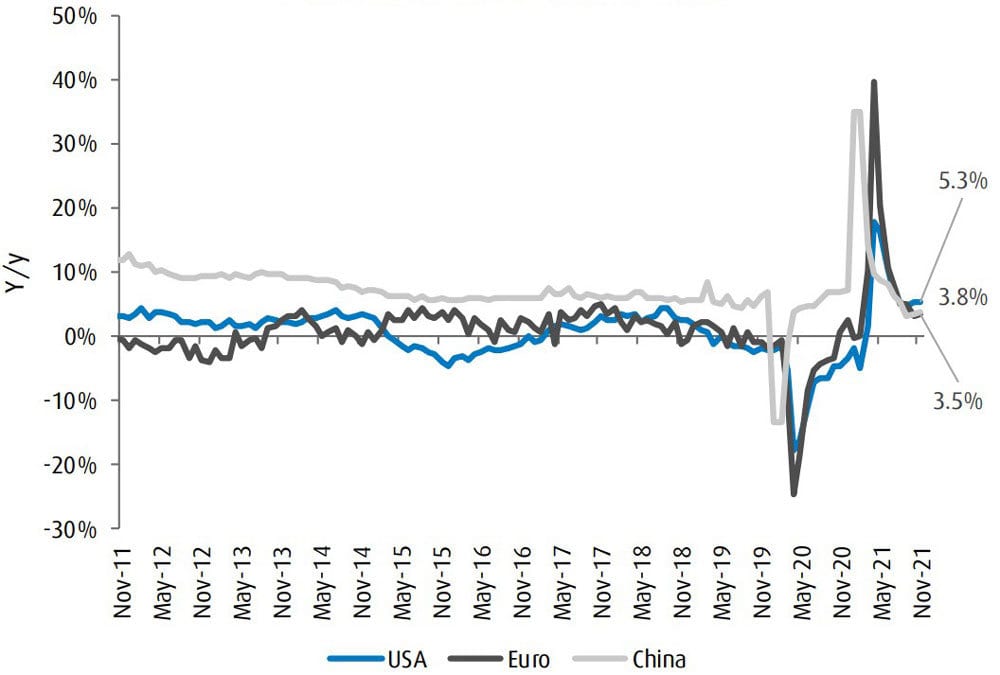
FIGURE 2 ǀ Industrial production growth for the U.S. and China is stable.
(Source: BMO Capital Markets, Trading Economics)
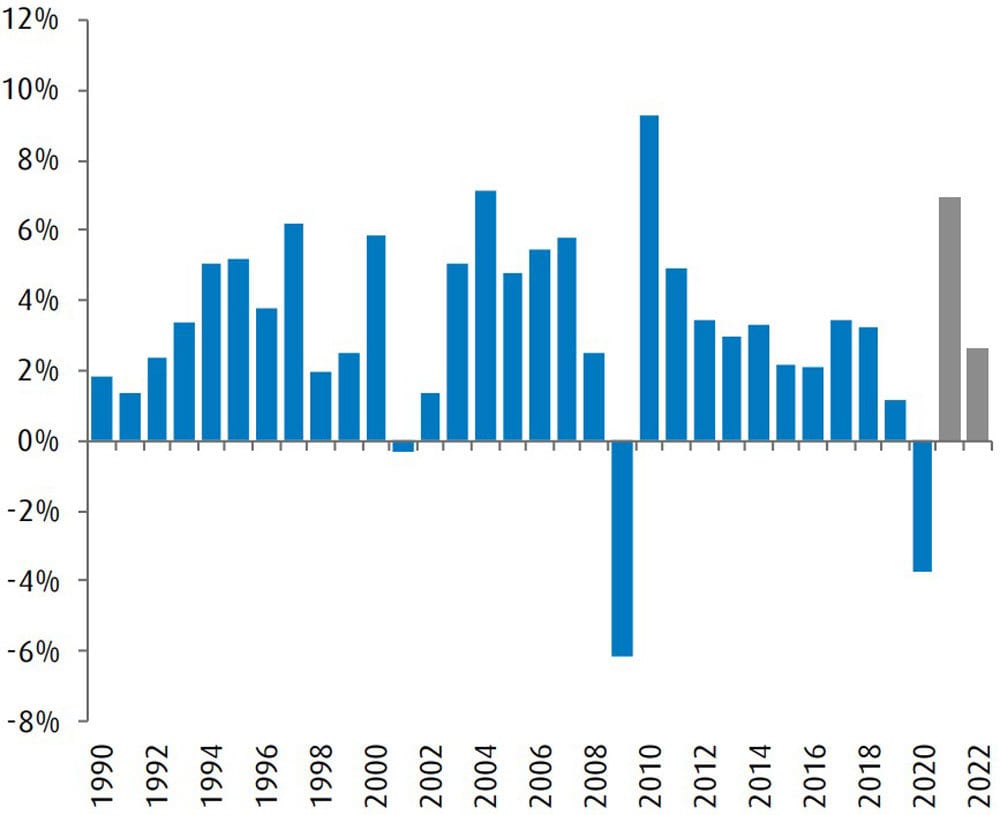
FIGURE 3 ǀ Global industrial production forecast (annual).
(Source: Bloomberg)
U.S. Economy
After contending with a variety of challenges in the past two years, the U.S. economy still has (at least) another pair of challenges in 2022 before returning to a full bill of health — the inflation pressures arising from both supply challenges and exploding global demand, and remaining effects of COVID-19, including travel resrictions, work from home and illness. However, fundamentally, many still hold an upbeat view that the U.S. economy will stay strong in the face of these challenges, and we look for above-trend growth again in the coming year, with lingering strength even out into 2023.
Some encouraging indicators to note:
- U.S. real GDP rebounded at a strong pace at the end of 2021, and a solid 3.5% growth in 2022 is expected.
- Many are expecting only a moderate restraint from Omicron, largely due to some new restrictions on travel, and some increase in consumer anxiety.
- Economic activity will come from elevated household savings, low interest rates and a sturdy housing market.
- The U.S. infrastructure plan should add 0.1% of GDP, and the “Build Back Better” plan could add another 0.6% of GDP.
- Business spending is on the rise, with nonresidential investment surpassing pre-pandemic levels.
- The unemployment rate is projected to fall further from 4.2% in November to pre-pandemic levels of 3.5% by late 2022.
U.S. Chemical Industry
The chemical industry is recovering as manufacturing activity resumes and stockpiles are rebuilt on the backs of a strengthening U.S. economy, and it is positioned to accelerate as strong consumer demand and restocking drive growth. This is reflected in production volume, as shown in Table 1.
TABLE 1 ǀ % Change in production volume.
Furthermore, by 2025, chemical sector capital spending in the U.S. is predicted to reach $37.3 billion, about three times what it was at the start of the last cycle in 2010 (Figure 4). Investment for bulk petrochemical and organic intermediates, along with that for plastic resins, will dominate.
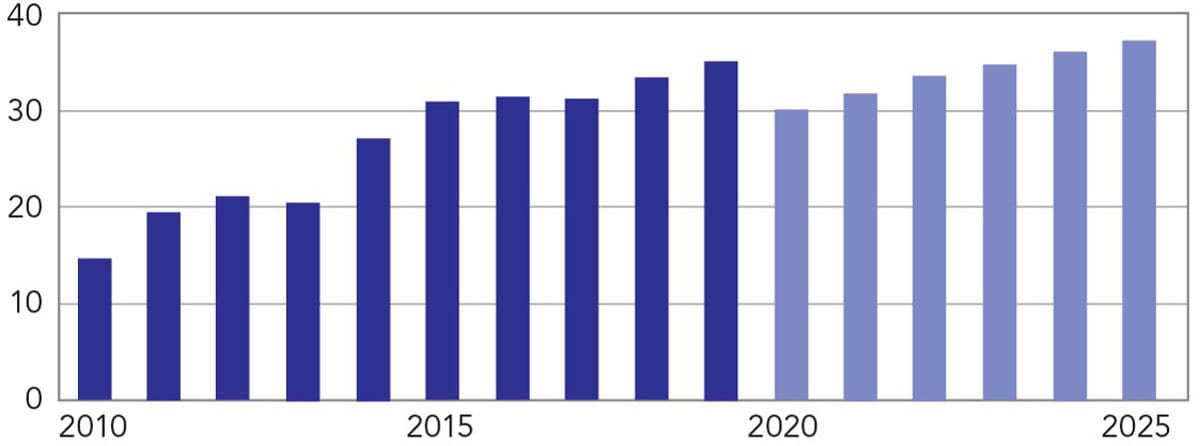
FIGURE 4 ǀ Chemical industry capital spending.
(Source: American Chemistry Council)
Chemical industry capital spending likely fell by 14% in 2020, where capacity utilization fell to 78% and will experience only a modest 4.8% gain in 2021. Growth will remain moderate in subsequent years but could pick up afterward if the business environment proves supportive.
The new capacity started up recently and slated to come online in the years ahead puts the U.S. in a top competitive position for the foreseeable future. More than half of the investments announced since 2010 have been completed or currently are under construction. As the global economy expands and key end-use markets strengthen, we expect growth in basic chemicals as well as most other chemical segments through 2025.
Significant risks to this outlook include, most prominently, the containment of COVID-19. Despite the recovery currently underway, the momentum of the world economy can’t gain traction until the health crisis abates.
Recent End Market Headwinds are Poised to Become Tailwinds
The coatings industry has also experienced a structural face-change. Sluggish recovery from end markets that were significantly hit by pandemic limitations and those limited by supply chain interruptions has continuously been the caveat to otherwise excellent sales growth for specialty coatings makers during 2021. Normalizing customer behavior and supply chain stabilization during 2022 should result in significant sales tailwinds when inventory replenishment and investment in these end markets restart.
Light vehicles are an important market for chemistry, with over $3,200 in chemistry per vehicle. In 2020, global car production fell, with supply chain lockdowns leading to order cancellations and, once production began, a halt in assembly due to semiconductor manufacturers' inability to satisfy demand (Figure 5).
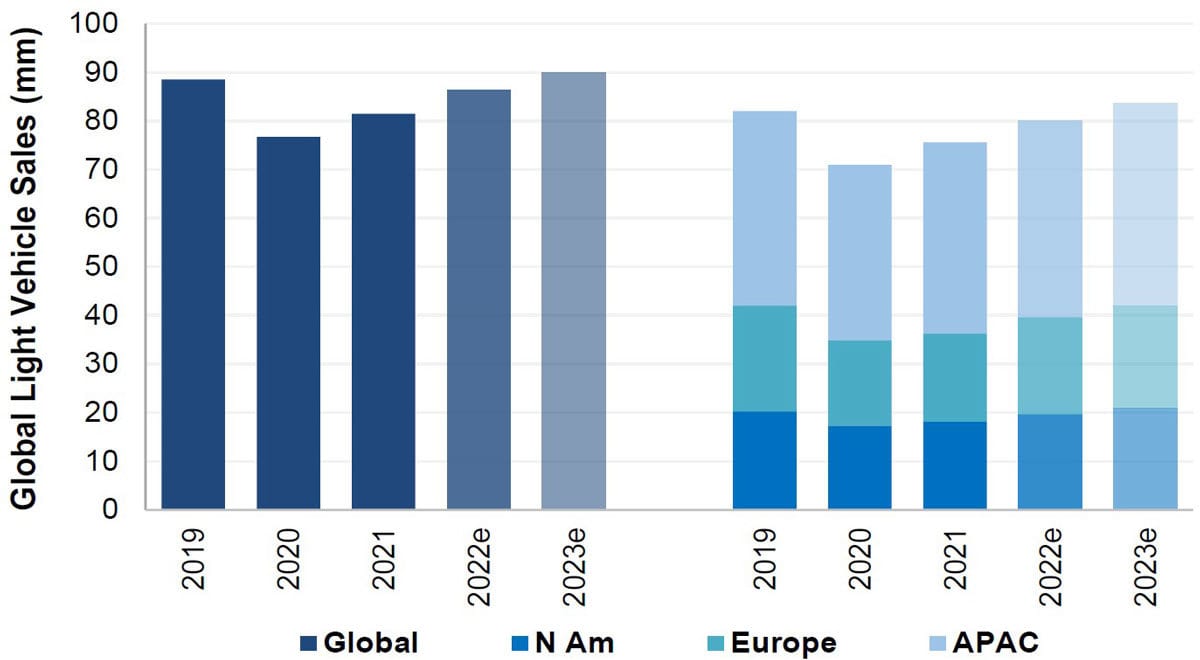
FIGURE 5 ǀ Global SAAR expected to grow.
(Source: Evercore, Bloomberg)
Vehicle sales in the U.S. increased to 15.3 million in 2021, up from 17.0 million in 2019 and 14.5 million in 2020 and are forecast to reach 16.0 million in 2022. Pent-up demand, return to work, pre-COVID commuting and favorable borrowing rates to benefit auto sales. Auto refinish should also continue to steadily improve towards pre-COVID levels. Although new COVID variants and a reversal of reopening trends have the potential to be significant headwind to the refinish end market.
Various mobility measures that are tracked continue to trend toward full recovery: U.S. vehicle miles traveled over the summer months came in just a few percentage points below pre-pandemic 2019 levels, and a near complete recovery is expected during 2022 (Figure 6).
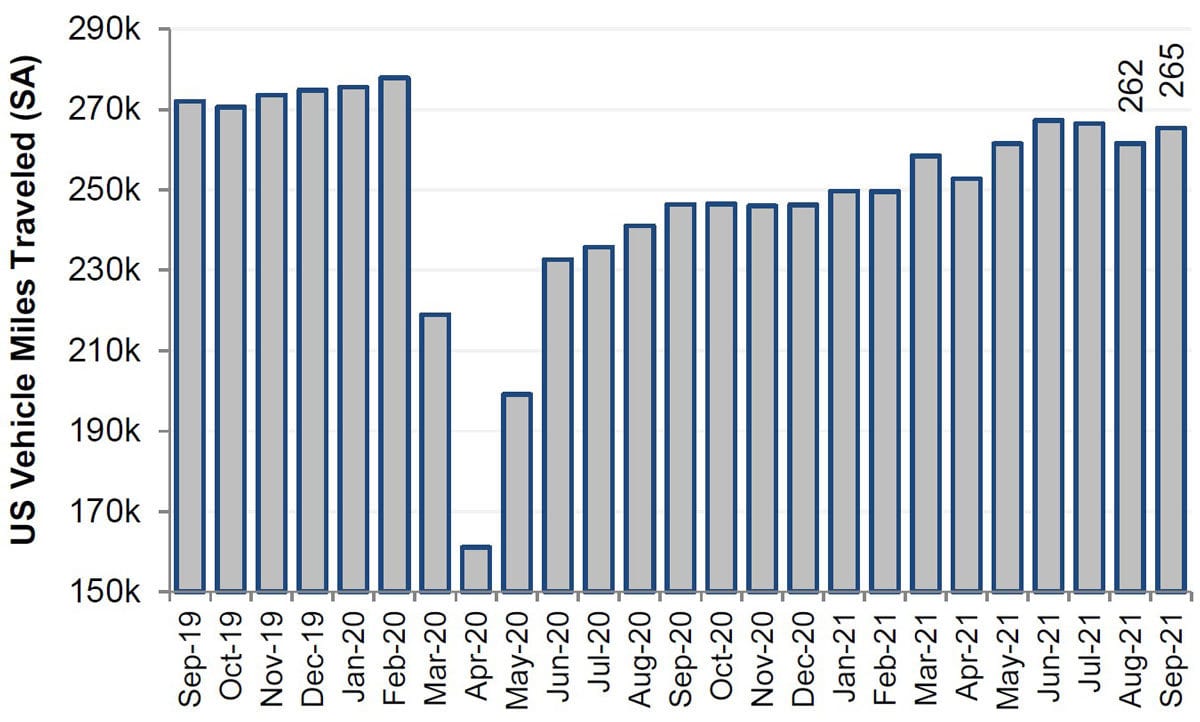
FIGURE 6 ǀ U.S. vehicle miles traveled have nearly recovered to pre-pandemic levels.
(Source: Evercore, Bloomberg)
International passenger routes have been fairly restricted until recently, despite the fact that domestic air traffic has resumed to a high degree. Global ASMs (available seat miles) for 2021 were still ~35% below 2019 levels, making clear the impact longer international routes have on total aircraft usage and consequently after-market aerospace coatings demand. Global ASMs are expected to further recover another ~30% during 2022, which should be a tailwind for the aero segment (Figure 7). Additionally, PPG indicated small plane (737, A320) order books are picking up, with wide-body orders more likely a 2023 tailwind. Travel restrictions connected with COVID variants like Omicron would have the most influence on aerospace in terms of further delaying recovery into 2H22, but World Health Organization (WHO) pronouncements that blanket bans do not prevent dissemination suggest any new restrictions will be targeted and temporary.
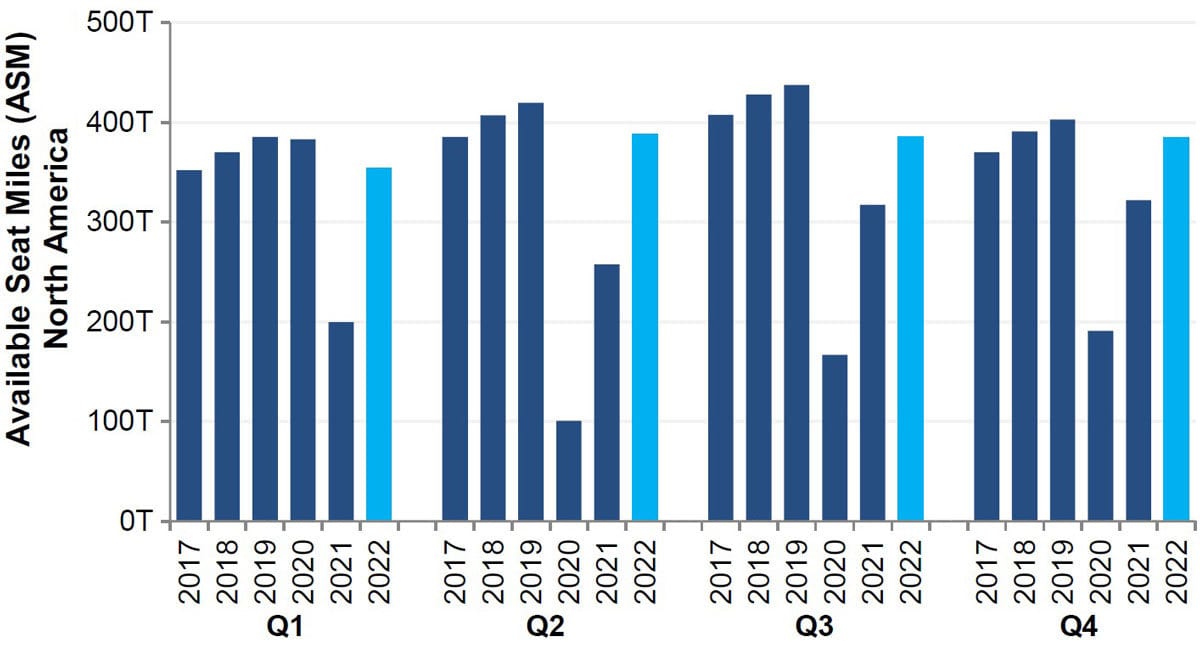
FIGURE 7 ǀ Airline ASMs projected up ~30% y/y in 2022.
(Source: Evercore, Bloomberg)
Coatings players with exposure to industrial end markets (such as RPM or ITW) are primed to benefit from continued pandemic recovery fiscal stimulus. Nearly $800 Bn of CARES Act money has yet to be spent, and the $1.9T COVID Relief Act should see cities, counties and states investing in projects like school building and renovation, which are critical to the Construction Product Group's growth. While the Build Back Better infrastructure funds are more likely to be granted in late 2022 or early 2023, they are expected to spur infrastructure spending (highways, bridges, ports and airports).
Housing/Construction is also a large consumer of chemistry. Housing starts rose during the pandemic as historically low mortgage rates, and remote work and learning led to a geographic dispersion of households (Figure 8).
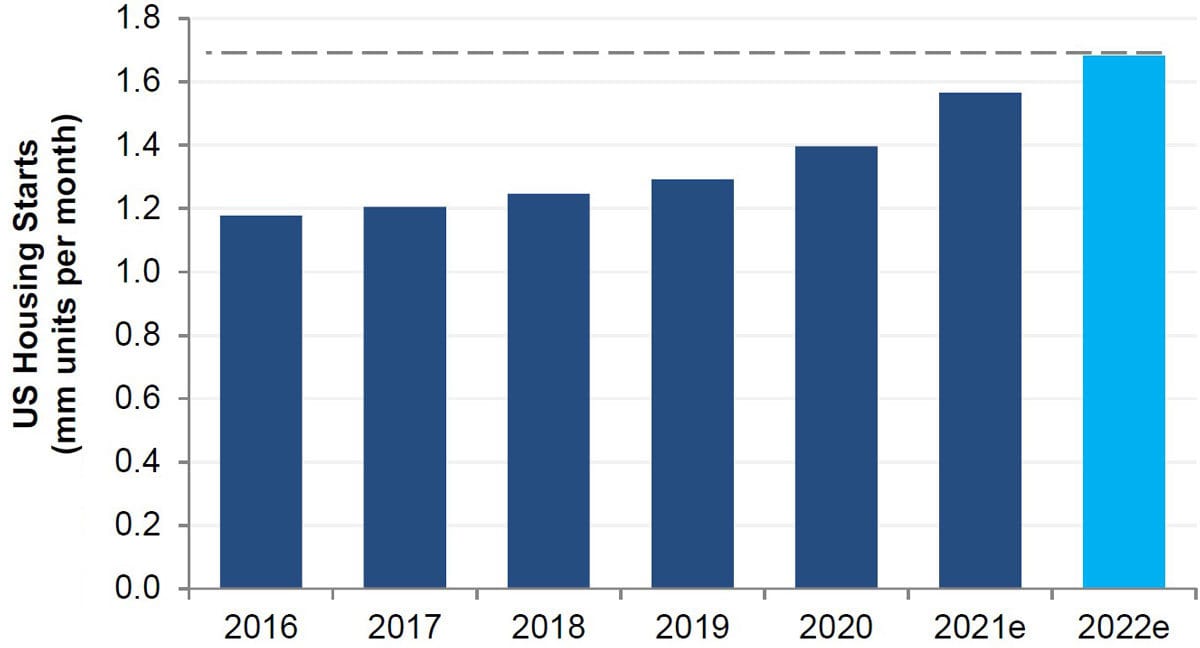
FIGURE 8 ǀ U.S. housing starts expected ~7% higher y/y in 2022 and ~30% above pre-pandemic 2019.
(Source: Evercore, Federal Reserve)
The U.S. housing market is expected to continue to be robust in 2022, driven by strong underlying fundamentals that include rising yet still favorable 30-year fixed mortgage rates, improving housing starts and existing home sales, and low housing inventory in the U.S.
It's also worth noting the effects of the country's two largest demographics: baby boomers (72 million people) who are aging in place and boosting renovation spending, and millennials (73 million people) who are starting families and driving demand for entry-level houses. Demand for homeownership is likely to remain robust as the huge millennial generation continues to move through the prime ages for forming households and buying homes.
Having said that, housing inventory is low, and supply chain challenges are limiting the amount of inventory that can be brought onto the market, therefore low inventory levels may serve to be a key barrier to housing development in 2022, though the subsiding pandemic and resumption of more normal activity should encourage more owners to put their homes on the market. An expanded supply of for-sale homes would help to slow the meteoric rise in house prices, but new construction also has to pick up substantially to keep homeownership relatively affordable.
The repaint and remodel end market is predicted to be strong in 2022, primarily driven by:
- An aging housing stock: the median age of a home in the U.S. is ~40 years old.
- Change in U.S. home values; home price appreciation gives homeowners confidence to remodel, even more so in a favorable interest rate environment.
- Strong macro fundamentals.
Unique to the industry, Sherwin Williams and other coatings manufacturers with direct exposure to consumers (contractor/PRO/DIY) are well positioned to take advantage of the favorable housing trends in 2022. With a controlled distribution model, the (company-owned) paint stores allow better control of pricing and inventory. Also, the stores offer higher customer focus through real-time feedback and direct relationship with end users.
DIY Activity
The pandemic was a boon for the remodeling industry by forcing a variety of housing and lifestyle changes that encourage improvement spending. Many owners found themselves unexpectedly in need of greater space to work from home, assist their children with remote learning and maintain social distance. Others welcomed aged parents, adult children or caretakers into their homes, whether on purpose or by accident.
However, this momentum has slowed, and consumer DIY activity has reverted, pointing to a slowdown relative to the initial uptick in the housing market, but still well above pre-pandemic levels of remodeling activity.
Coatings Raw Materials
For most coatings players — raw materials represent ~80% of the cost of a coating product on average (Table 2 and Figure 9). Manufacturing overhead, distribution and other costs account for the remaining 20% of total coatings product costs. Accordingly, every 2% increase in raw material costs requires a 1-2% increase in selling prices to offset these headwinds.
TABLE 2 ǀ Major paint raw materials (cost/gallon of paint).
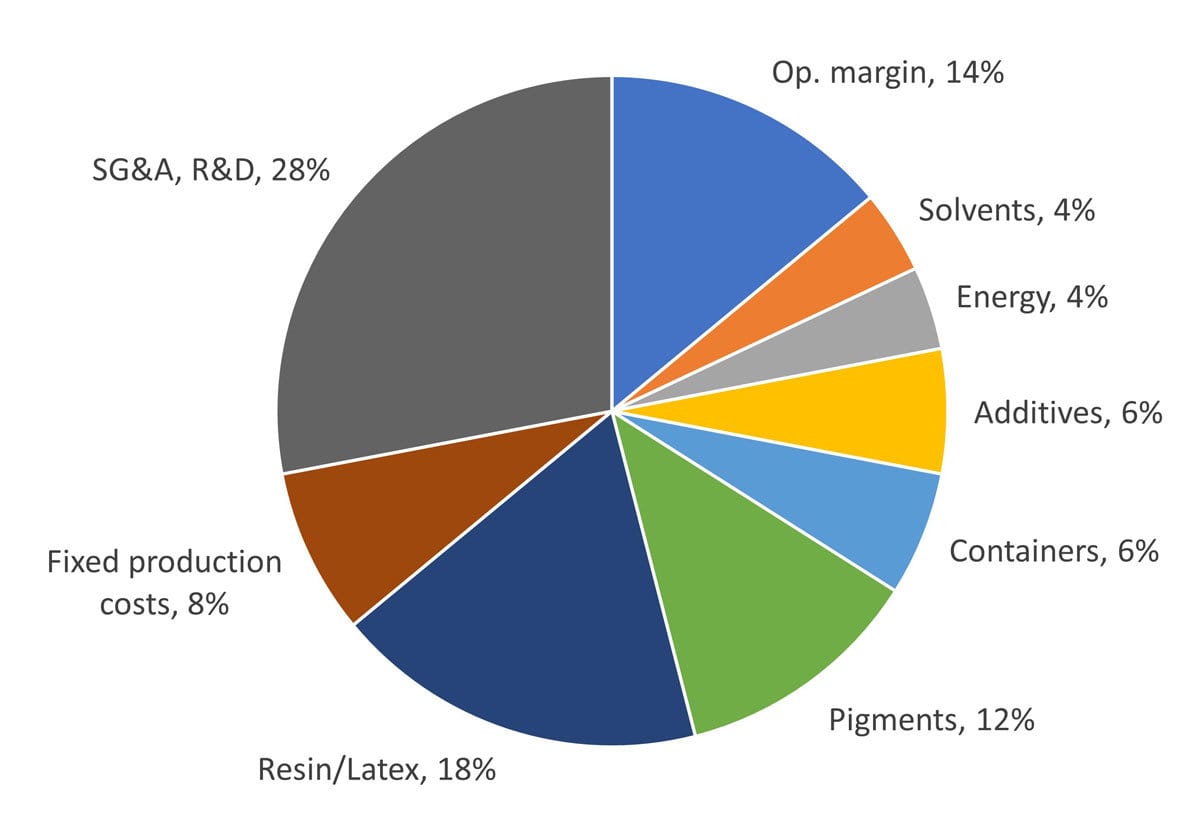
FIGURE 9 ǀ What a typical, ‘good’ coatings company P&L looks like.
(Source: Exane BNP Paribas)
Raw material inflation has been in focus throughout the past 12 months, but only became an issue from the middle of the Q2 21. There was widespread confidence that raw material interruptions would ease in Q3, but they instead worsened, resulting in considerable underperformance for coatings companies.
And so, in Q4 of last year the coatings industry experienced an uptick of ~25% year over year raw material inflation. Coatings firms typically need about a 12-13% price increase to fully pass on inflation (if everything else being equal). This is, of course, a very difficult bar to clear in an industry where annual price increases are normally 1-2%.
The squeeze in margins seen currently should, however, not be seen as a demonstration that the industry lacks pricing power. From mid-2018 to mid-2020, raw materials fell over 20%, and prices if anything went slightly up (Figure 10). Similarly, we've heard from a few coatings companies that a 10% price rise over the next two quarters is on the table. This should help margins in 2022 regain the ground lost in 2021.
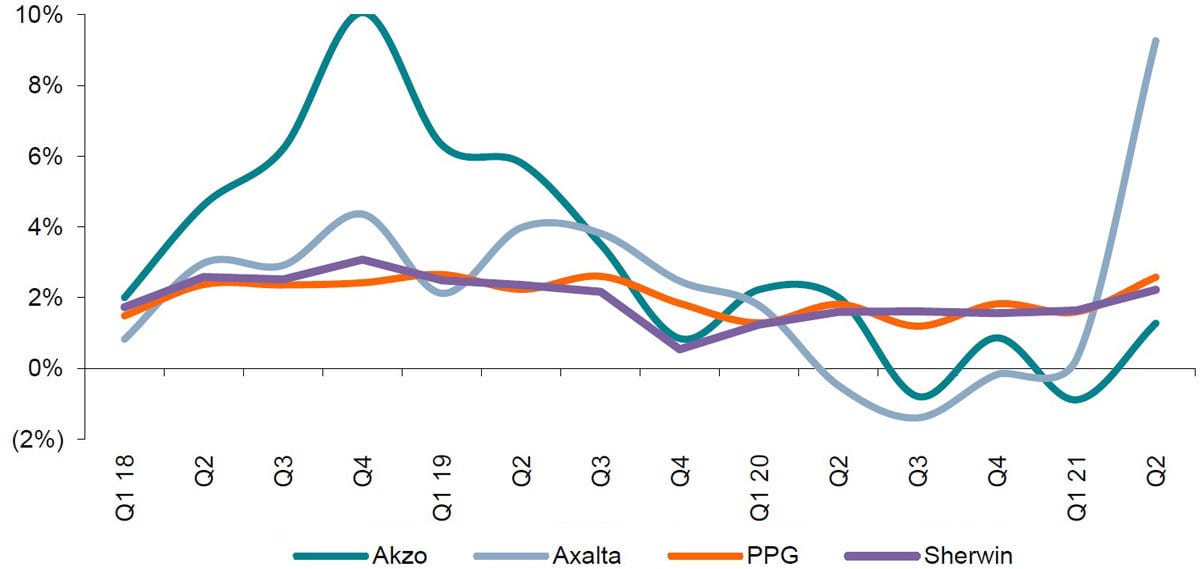
FIGURE 10 ǀ Price increases tracker over the last three years.
(Source: Exane BNP Paribas)
Specifically, benzene, PVC and nylon rose 6%, 5% and 2%, respectively, while polypropylene and ethylene fell 10% and 1%, respectively. On a y/y basis, benzene, polypropylene, ethylene, nylon and PVC rose 106%, 72%, 44%, 43% and 37%, respectively (Figure 11).
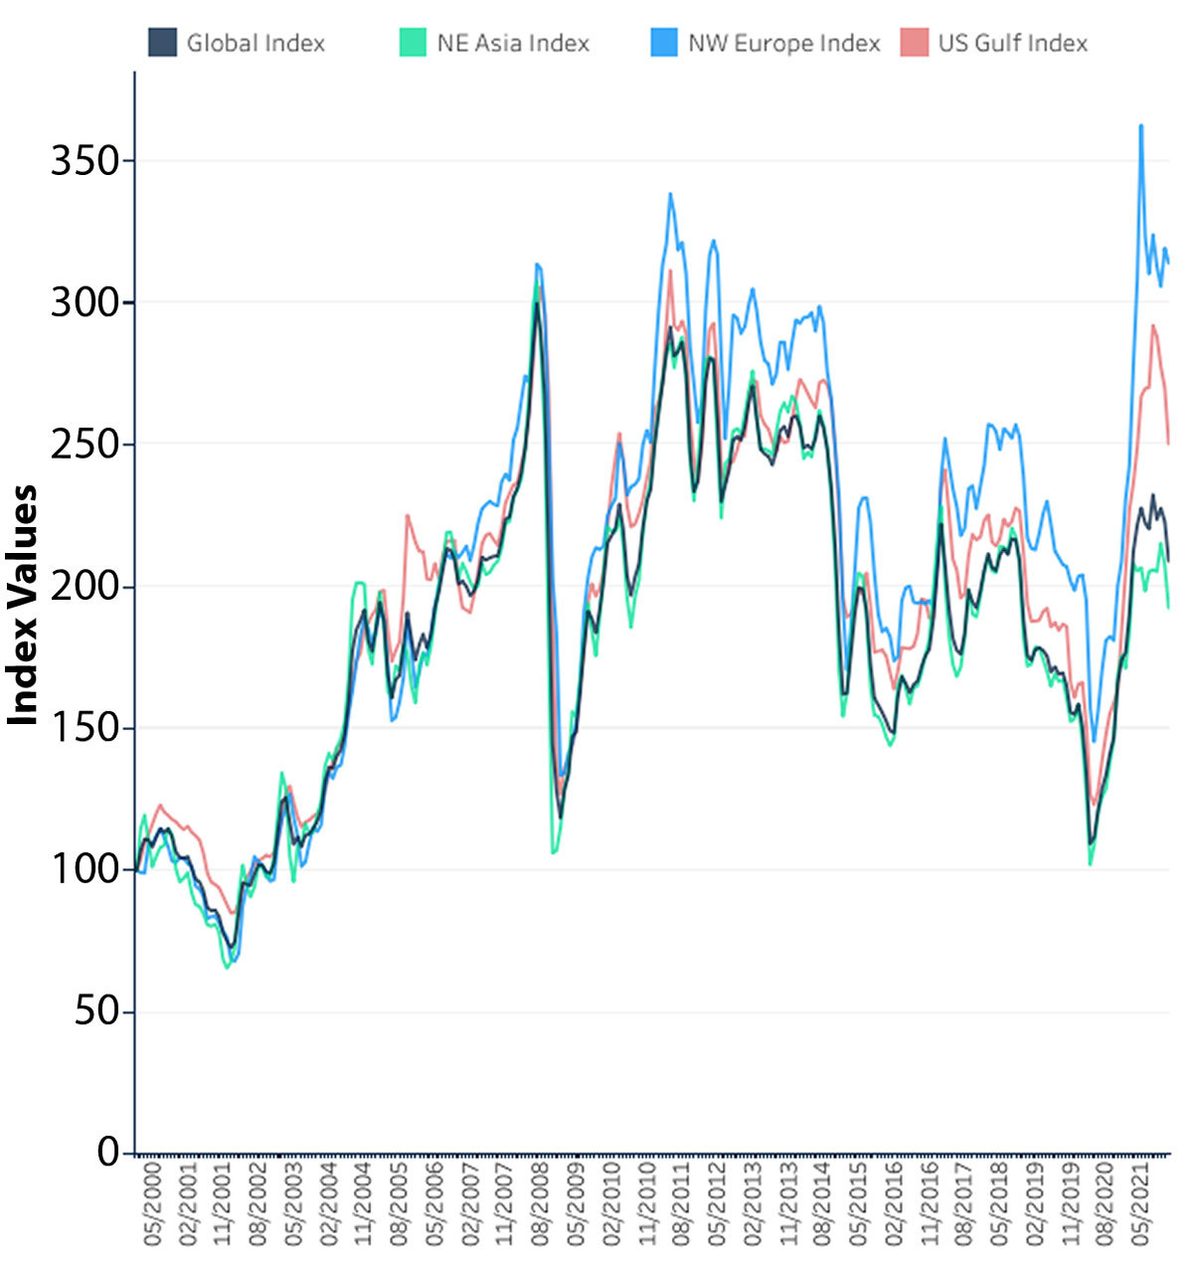
FIGURE 11 ǀ ICIS Global Petrochemical Index (IPEX).
.
The index tracks the movement of prices for the 12 major petrochemicals and polymers: ethylene, propylene, butadiene, benzene, toluene, paraxylene (PX), polyethylene (PE), polypropylene (PP), styrene, polystyrene (PS), methanol, and polyvinyl chloride (PVC), with the regional indexes weighted by capacity. The IPEX values are related to a January 2000 base of 100.
Thus, after a dramatic jump in raw material prices, prices currently appear to be trending lower (as seen specifically with propylene and ethylene), owing to a relaxing of supply/demand conditions, after a period of severe force majeure interruptions. However, given the current state of the supply chain, we must be cautious in our expectations.
The impact of outages on the petrochemical industry (using ethylene as proxy) has been significant in recent years, particularly unplanned outages as abnormal weather and COVID have taken their toll. Aside from the temporary challenges posed by the ice storm in Texas, which were severe, the scarcity of electric power also created significant consequences for chemical companies. Manufacturing plants had to shut down because of the need to divert and conserve electric power so that it could be preserved for residential and emergency needs. That is a weakness in the system that had remained under-appreciated prior to the February 2021 severe weather event. Overall, those expectations appear to be what the market is pricing in with the chemical intermediate assets that produce those raw materials.
Conclusions
For the U.S. coatings industry, underlying demand looks to have remained quite healthy and supportive of solid growth through 2022. Residential leads are comping positive year over year in Nov/Dec for pro painters, extending project backlogs that look up 8% year over year to close 2021 (Source: Cleveland Research). We also see a constructive outlook for commercial jobs despite the recent COVID-variant challenges. Commercial leads are up double digits over the last three months, and job growth is expected to rise 10% in 2022, driven specifically by strength in the healthcare, retail, government and warehouse verticals. Industrial segments expect 10% increase in 2022 over 2021, where industrial order backlogs are nearly 30% higher. Overall, Pro paint demand looks solid into 2022.
Look for Part 2 of this article in PCI's April issue.