Ready to proof -- Clare 4-5-21
KJ proofed and sent pdf corrections to Clare on 4/7
CLJ revised on 4/8
Second round of corrections sent to Clare on 4/12
CLJ revised on 4/12
Proof sent to author on 4/12
DID YOU KNOW?

Differential Scanning Calorimetry
An Important, Even Critical, Tool for Determining the Morphology of Composite Latex Particles
Video credit: ilyast / Creatas Video, via Getty Images
Those who are responsible for providing reliable analyses for establishing the phase structure of composite particles know that complete characterization is quite challenging, sometimes complicated, and often lacking for suitable methods. To be complete one needs to establish: 1) the degree to which the two polymers are physically separated within the particle; 2) the amount of interfacial polymer between the separated phases; 3) the relative locations of each polymer in the particle; and 4) the polymer composition at the periphery of the particle (i.e. at its water interface).
Transmission electron microscopy (TEM) (and sometimes Atomic Force Microscopy, AFM) can be very helpful for number 3 above – but it is not generally a quantitative analysis and is dependent upon one’s ability to selectively stain the polymers for contrast in the electron beam. Sample preparation and correctly focusing the beam can be challenging and potentially lead to errors of interpretation. Surfactant titration can be useful in determining the polymer composition at the particle surface. Acid comonomers can complicate such measurements, but one can turn to acid titrations with base to determine the amount of acid copolymer in the external region of the particle, but not necessarily that at the very surface of the particle where the surfactants adsorb.
Items 1 and 2 above can be quantitatively measured by Differential Scanning Calorimetry (DSC). When the two polymers have Tgs more than 20 ºC apart, the DSC signal (Figure 1) can yield the amounts of “pure” polymers and the amount of interfacial polymer [Thermochimica Acta, 568, 20-30 (2013)]. It cannot tell you where the polymer phases are located in the particle. However, it is the first, best analytical measurement that we recommend be done for composite particles, and can suggest whether or not going to the TEM will be worthwhile. Additionally, the DSC data (especially in derivative form as shown below, where the sample labeled “SOI” represents the “as polymerized” sample, and the “seed” is the acrylate polymer) can yield information about the uniformity (or lack thereof) of the copolymer composition of either “pure” polymer.
As always we welcome your questions and comments via www.epced.com.
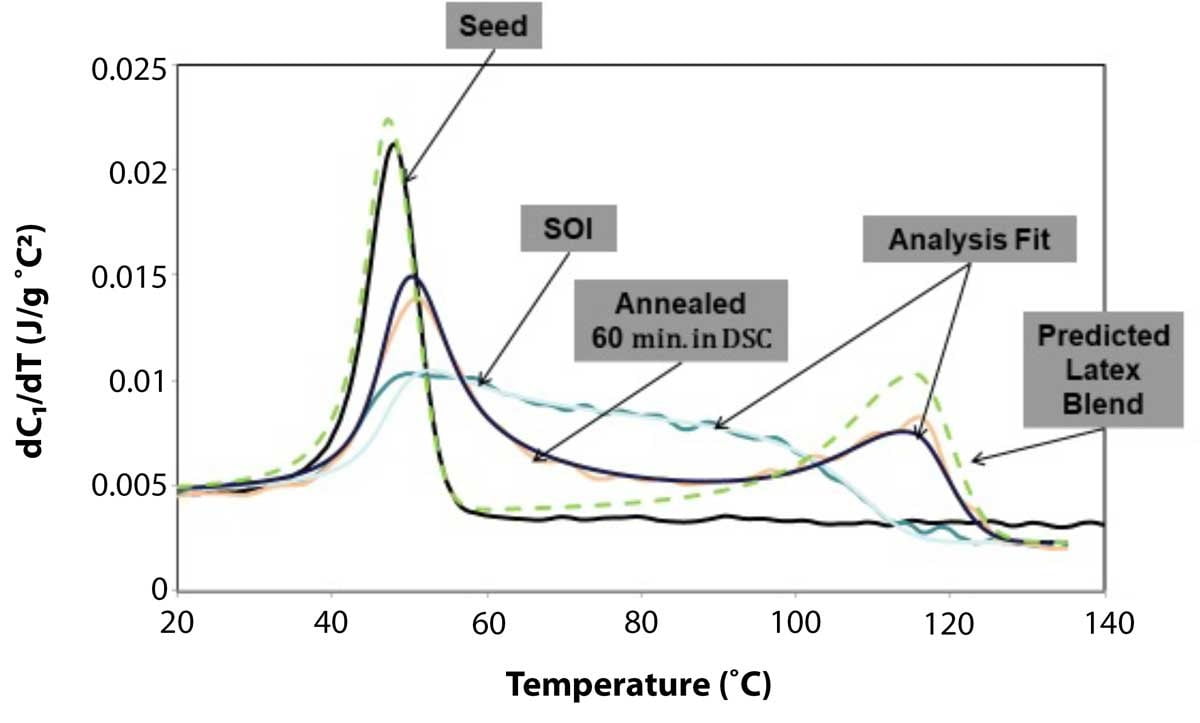
FIGURE 1 ǀ DSC signal for p(MA-co-MMA)/p(10% AA-co-Sty).

The “Did You Know….?” series is a bi-monthly note from Emulsion Polymers Consulting and Education (EPCEd) that is intended to present simple questions about topics that are important to those working in the emulsion polymers area. Short and concise answers to those questions are presented to educate readers and to elicit comments and further discussion. Some readers will already know the answers and be familiar with the topic while others, especially those newer to the field, will benefit from the answers and discussion. Experienced practitioners may also find new insights in the discussion. Paint & Coatings Industry magazine has partnered with EPCEd to share the “Did You Know” notes with our readers throughout the year.